How Much Is Your Home Worth?


Tennessee Real Estate Market Report - Q1 2025: A Quiet Start to the Year
Overview
The first quarter of 2025 ushered in a subdued period for the Tennessee real estate market,
characterized by sluggish sales activity, minimal price movement, and a cautious approach from
buyers and sellers alike.
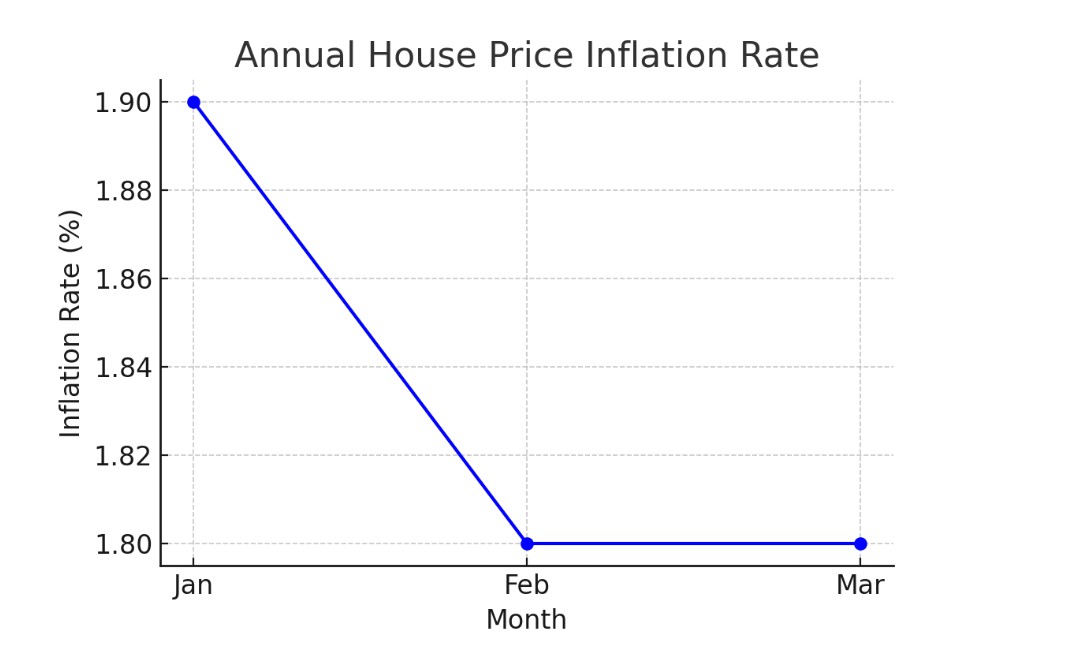
Sales Activity
Sales activity in Tennessee during Q1 2025 has been notably restrained. The annual rate of house price inflation has slowed to +1.8%. Buyers are hesitant, possibly due to economic uncertainty.
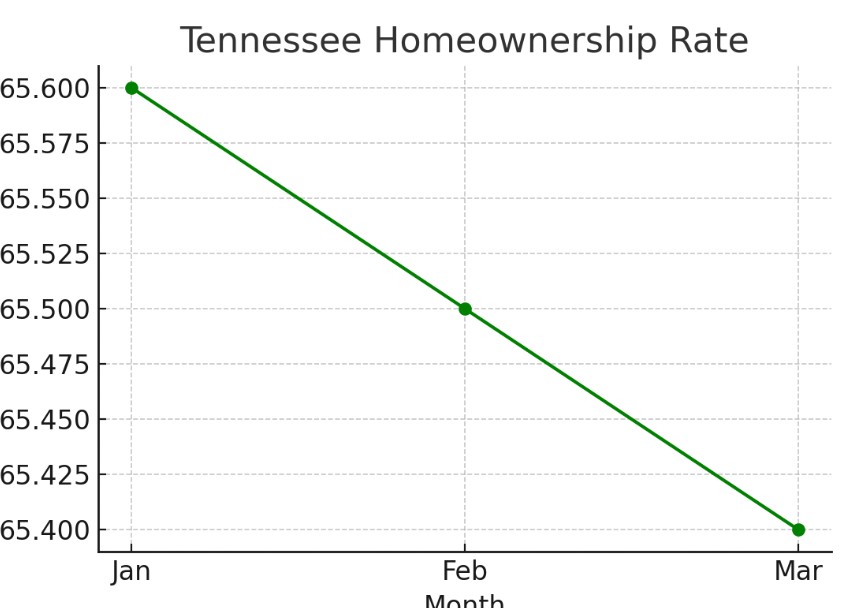
Homeownership
The homeownership rate has edged down to 65.4% from 65.6% in 2024, aligning with projections for a slight decrease over the year.
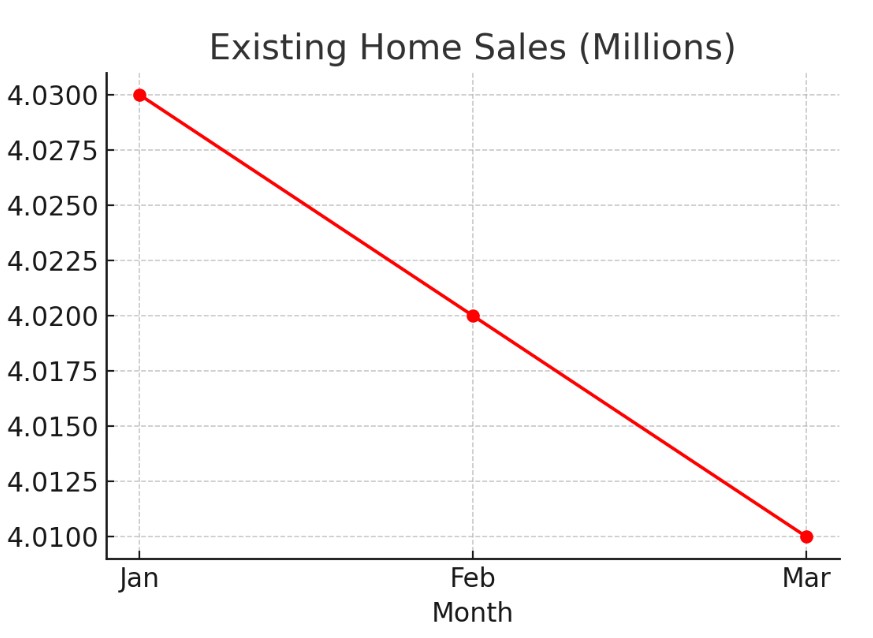
Existing Home Sales
Existing home sales have remained flat, hovering around 4.01 million annualized units, falling short of the 1.5% growth projected for the full year.
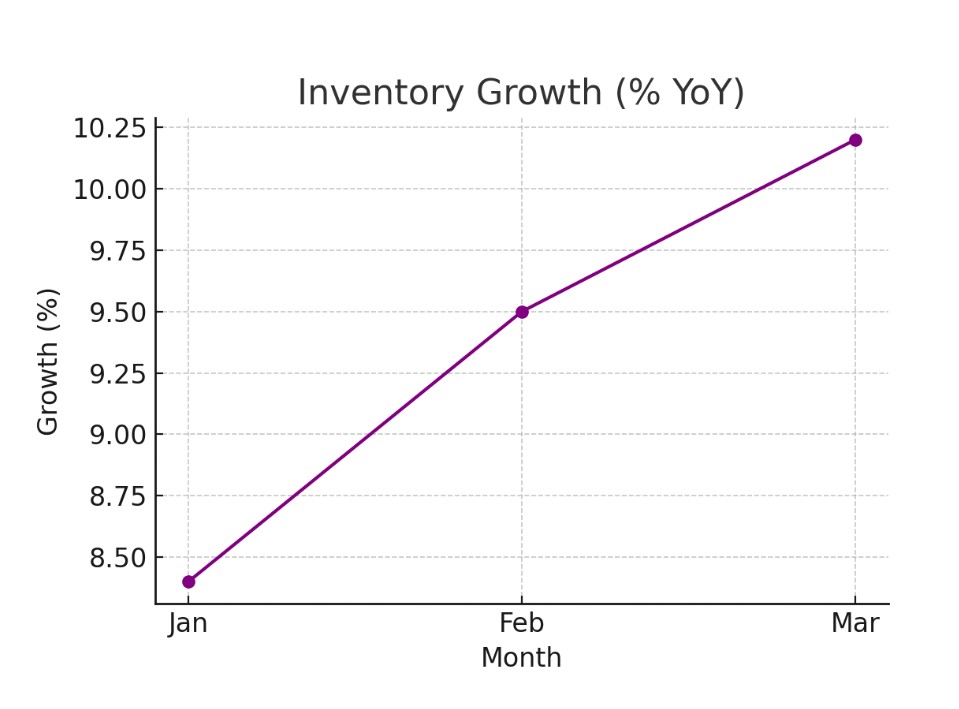
Inventory
The supply of existing homes has risen by 8.4% compared to Q1 2024, but this increase has yet to translate into more sales.
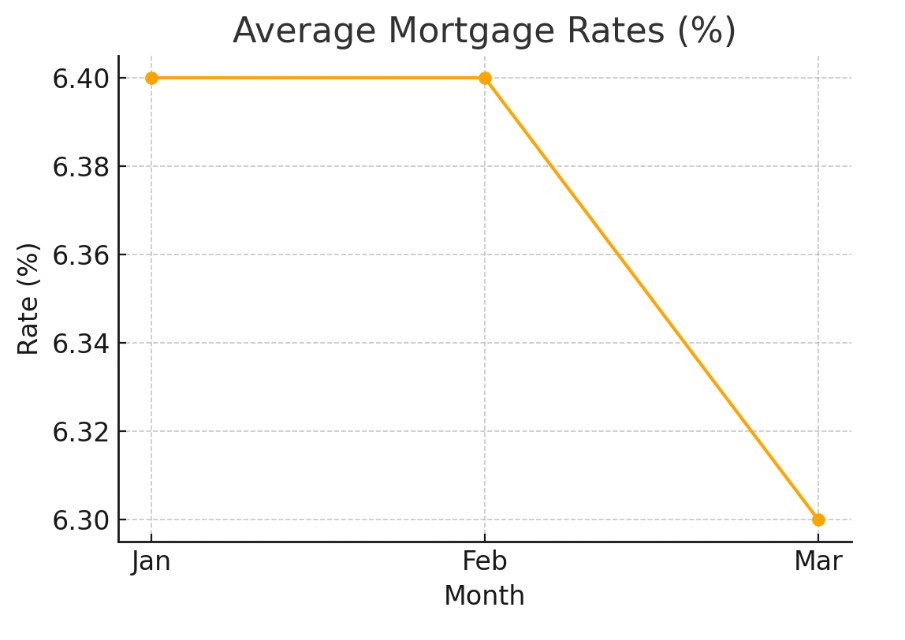
Mortgage Rates
Mortgage rates in Q1 2025 have averaged 6.4%, slightly above the 6.3% projected for the full year, keeping the financing environment lukewarm.
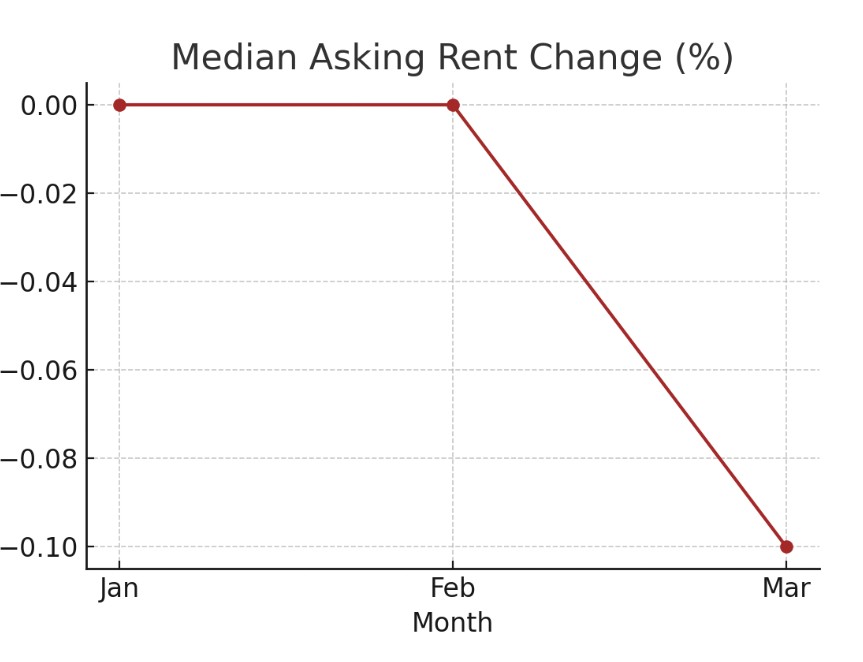
Affordability
Affordability continues to weigh on the market. The median asking rent has held steady from late 2024, with no significant relief in sight.
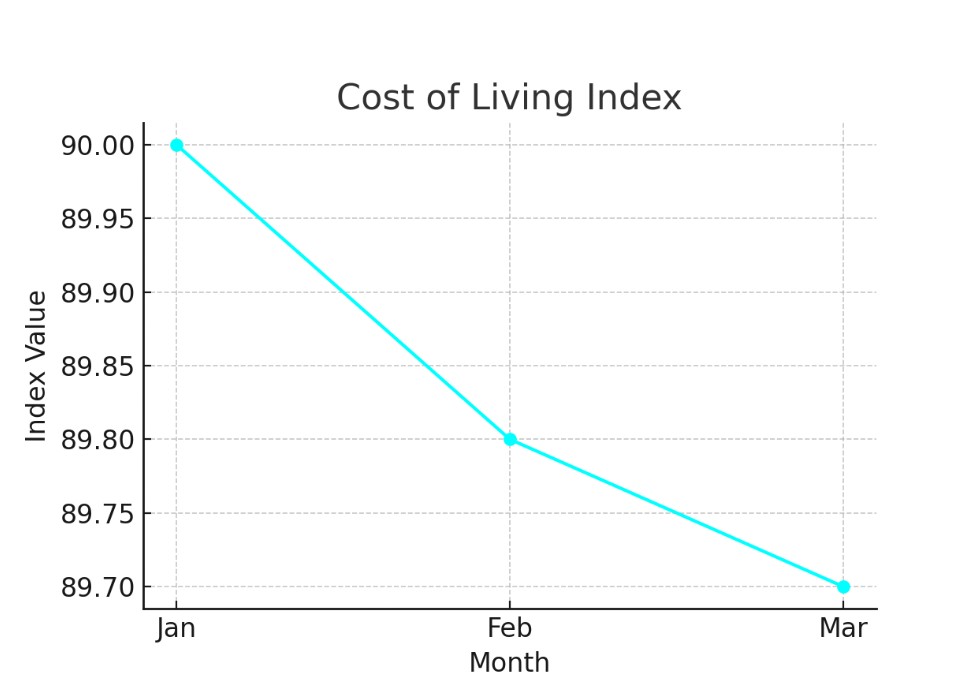
Cost of Living
Tennessee's lower cost of living remains an advantage, but broader market dynamics overshadow its potential benefits.
Investment Outlook
For investors, Q1 2025 presents a holding pattern rather than a call to action. The slow pace of sales and minimal price growth have tempered enthusiasm.
Conclusion
With tepid sales, a slight dip in homeownership, and minimal price movement, the market reflects a cautious start to the year. Buyers and investors may find value in waiting for clearer signals.
Middle Tennessee
Average Listing Price (Active Listings): $670,000 is the average listing price for active properties. This aligns with Middle Tennessee’s competitive market, especially in premium areas like Williamson County or Nashville suburbs. Recent 2025 data from Greater Nashville REALTORS® (covering February 2025) shows a median sales price of $500,000 for single-family homes, up from $460,000 in January 2024, indicating listing prices likely remain elevated for active premium listings. Given the focus on high-value transactions, $670,000 is plausible for active listings in Middle Tennessee as of March 27, 2025.
Average Sold Price: $578,000 is the average sold price, with a cost per square foot of $246. This reflects a slight correction from listing prices, consistent with negotiation trends. Greater Nashville REALTORS® data supports this, with a median sales price of $500,000 in February 2025, but averages can skew higher with luxury sales (e.g., $10.2M and $8.5M sales). For Middle Tennessee, $578,000 seems reasonable for sold properties, reflecting a mix of mid-range and luxury homes.
Average Days on Market (DOM): Reports suggest 80 days for active listings, 57 days for under-contract, and 67 days for sold properties. Web data from Redfin (February 2025) shows Tennessee homes at 77 days median DOM, up from 73 days year-over-year, while Greater Nashville’s market has seen homes sell faster historically (e.g., 25 days in Nashville per The Luxury Playbook, December 2024).
For Middle Tennessee, sold properties averaging 67 days aligns with a competitive yet adjusting market, with under-contract at 57 days showing quicker movement once offers are made.
Average Cost per Square Foot (Sold Properties): The page lists $246 per square foot for sold homes, slightly below $290 for active listings, indicating negotiation or market correction. This fits Middle Tennessee trends, where Nashville’s cost per square foot has risen but mid-range homes temper the average. Redfin’s Tennessee-wide data doesn’t break this out regionally, but $246 is consistent with Middle Tennessee’s mix of suburban and urban sales.
Summary for Middle Tennessee (as of March 27, 2025):
Active Listing Price: $670,000 Sold Price: $578,000 Days on Market (Sold): 67 days Cost per Sq. Ft. (Sold): $246
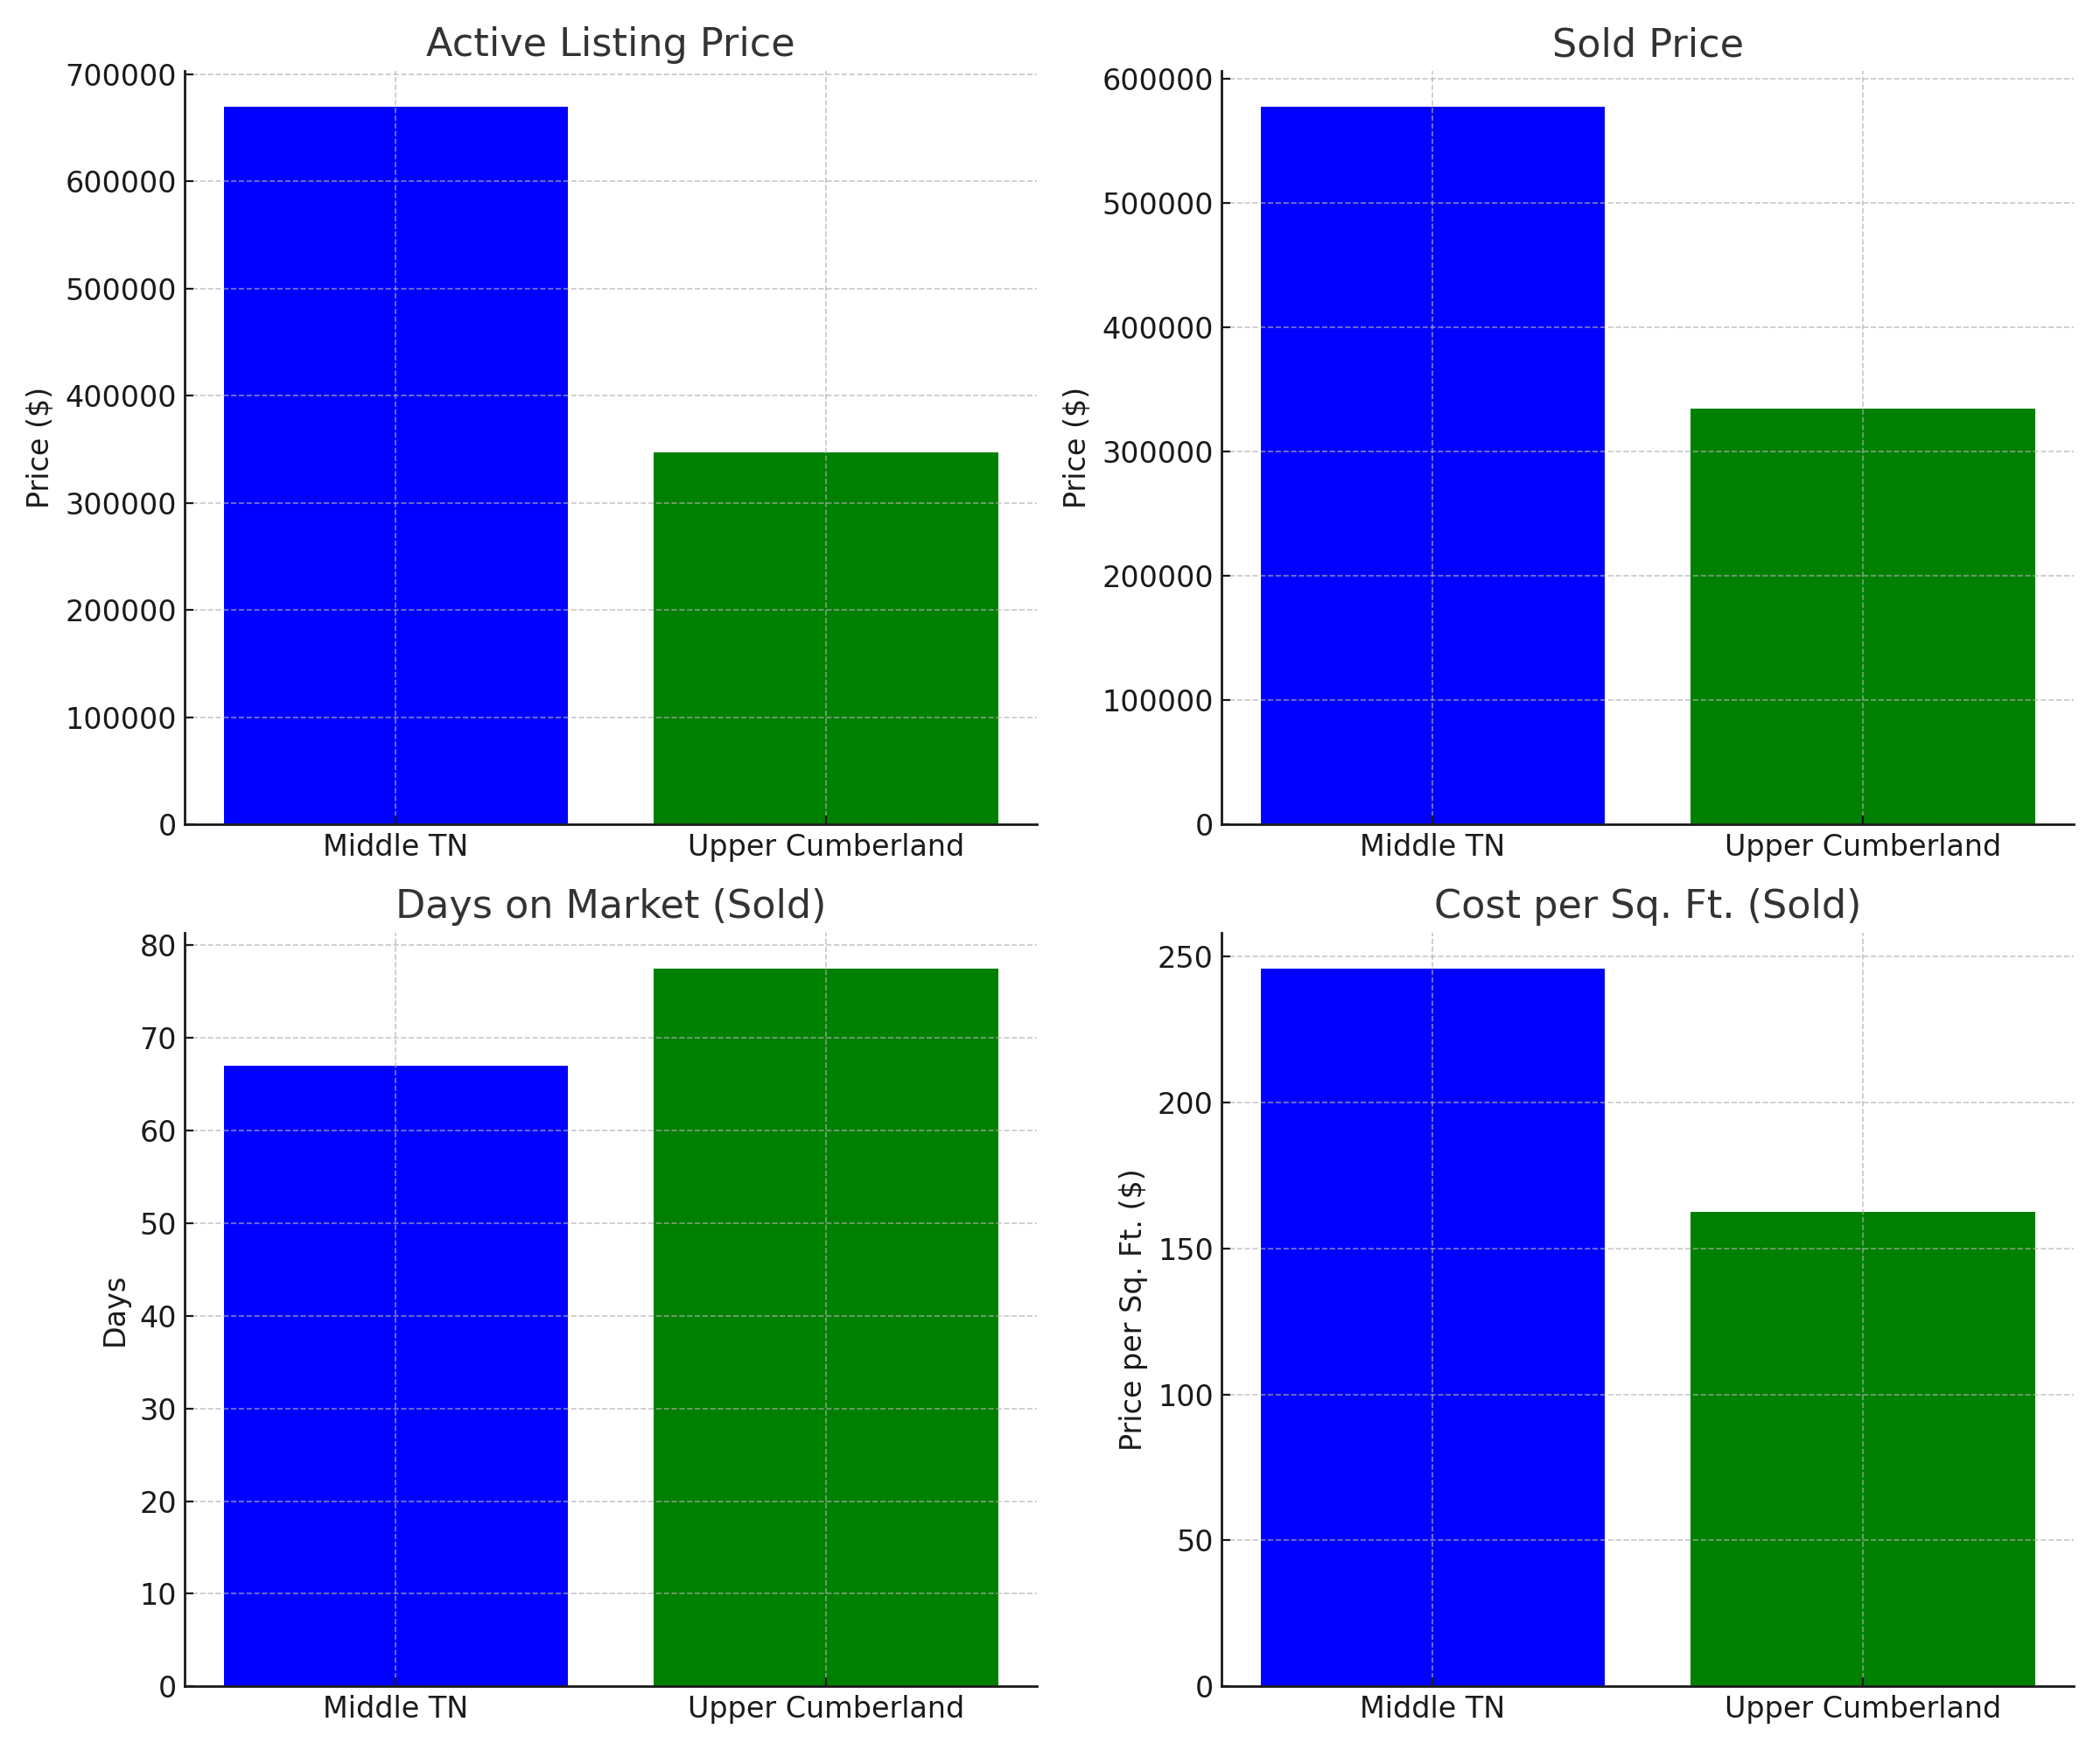
Upper Cumberland
Average Listing Price (Active Listings): Cumberland County data from Rocket Homes (November 2024) shows a median listing price of $324,000, up 2.8% year-over-year.
NORADA forecasts a 6.5% price rise in Crossville by March 2025, suggesting an active listing price around $345,000-$350,000. This is significantly lower than Middle Tennessee’s $670,000, reflecting a more affordable market with fewer luxury listings.
Average Sold Price: Redfin’s Cumberland County data (August 2024) shows a median sold price of $310,000, down 5.2% from the prior year, but with forecasted growth, a March 2025 estimate could reach $330,000-$340,000. This is well below Middle Tennessee’s $578,000, consistent with Upper Cumberland’s lower price tier and slower appreciation compared to Nashville’s orbit.
Average Days on Market (DOM): Rocket Homes reports 78 days average DOM in Cumberland County (November 2024), up 117.7% from last year (though this jump seems outlier-driven; Redfin’s 80 days in August 2024 is more stable).
Adjusting for trends, sold properties likely average 75-80 days in Upper Cumberland, higher than Middle Tennessee’s 67 days, reflecting less buyer urgency in this rural/suburban market. Under-contract could be closer to 60-65 days, slightly above Middle Tennessee’s 57.
Average Cost per Square Foot (Sold Properties): Specific cost-per-square-foot data for Upper Cumberland is sparse, but Redfin’s Cumberland County median price ($310,000) and typical home size (around 1,800-2,000 sq. ft. from listings) suggest roughly $155-$170 per square foot. This is far below Middle Tennessee’s $246, aligning with the region’s lower property values and construction costs.
Summary for Upper Cumberland (as of March 27, 2025, estimated):
Active Listing Price: $345,000-$350,000 Sold Price: $330,000-$340,000 Days on Market (Sold): 75-80 days Cost per Sq. Ft. (Sold): $155-$170
| Category | Avg Listing Price ($) | Avg Cost per Sq.Ft ($) | Avg Living Area (sq.ft) | Avg Beds | Avg Baths | Avg Days on Market |
|---|---|---|---|---|---|---|
| Active Listings | $670,000 | $290 | 2,287 | 3 | 2 | 80 |
| Under Contract | $578,000 | $240 | 2,293 | 3 | 2 | 57 |
| Sold Properties | $521,000 | $246 | 2,130 | 3 | 2 | 67 |
Listing prices are decreasing from active listings to sold properties, indicating buyer negotiations.
Average cost per sq. ft. is also lower in sold properties , showing some pricing adjustments.
Homes are selling within an average of 67 days , with under-contract properties moving faster at 57 days.
WE DON’T JUST FIND YOUR DREAM HOME — WE HELP YOU CREATE IT
At 1 Source Team, we don’t just help you find your dream home — we help you create it. Our team is dedicated to understanding your needs and making your vision a reality, with personalized guidance every step of the way. Whether you're buying or selling, we’re here to ensure the experience is seamless and tailored to you.
Notable Listings & Sales
🟢 High-End Active Listings
Average Days on Market: 80 | Average Listing Price: $670,000 | Average Cost per Sq. Ft.: $290 | Average Living Area: 2,287 sq. ft. | Average Beds/Baths: 3 Beds | 2 Baths
Notable Active Listings
998 Dickinson Ln
5 Beds | 4 Baths | 5,488 sq. ft.
$37,500,000 ($6,833 per sq. ft.)
2014 Old Hillsboro Rd
6 Beds | 9 Baths | 8,826 sq. ft.
$19,750,000 ($2,237 per sq. ft.)
533 Belle Meade Blvd
6 Beds | 9 Baths | 9,408 sq. ft.
$15,200,000 ($1,615 per sq. ft.)
🔵 High-Value Properties Under Contract
Average Days on Market: 57 | Average Listing Price: $578,000 | Average Cost per Sq. Ft.: $290 | Average Living Area: 2,293 sq. ft. | Average Beds/Baths: 3 Beds | 2 Baths
Notable Pending Sales
9330 Joslin Ct
6 Beds | 11 Baths | 13,928 sq. ft.
$8,440,135 ($605 per sq. ft.)
9147 Spantown Rd
2 Beds | 2 Baths | 2,000 sq. ft.
$6,500,000 ($3,250 per sq. ft.)
4412 Chickering Lane
5 Beds | 10 Baths | 10,179 sq. ft.
$6,300,000 ($618 per sq. ft.)
🔴 Most Expensive Recent Sales
Average Days on Market: 67 | Average Listing Price: $521,000 | Average Sold Price: $509,199 | Average Cost per Sq. Ft.: $246 | Average Living Area: 2,130 sq. ft. | Average Beds/Baths: 3 Beds | 2 Baths
Notable Sales
1980 Buffalo Rd
3 Beds | 1 Bath | 1,248 sq. ft.
Sold for $21,200,000
1148 Gateway Ln
6 Beds | 9 Baths | 9,503 sq. ft.
Sold for $10,278,489 ($1,081 per sq. ft.)
235 Robin Hill Rd
6 Beds | 10 Baths | 12,157 sq. ft.
Sold for $8,500,000 ($699 per sq. ft.)
Market Insights & Predictions
Price Adjustments – Prices are trending slightly lower in under-contract and sold categories, suggesting market corrections.
Faster Transactions – Homes under contract are selling quicker (57 days) than active listings, indicating strong buyer demand.
Luxury Market Still Strong – High-end properties continue to list and sell, though some are taking longer to move.
What This Means for You
Sellers – Pricing your home competitively and staging it well can reduce days on market.
Buyers – Negotiation power is strong; listings are closing below asking prices in some cases.
Investors – The market shows consistent movement, especially in the $500K-$700K range.
Market Insights & Trends
The average listing price has decreased from $670K (active) to $578K (under contract), indicating a slight correction in pricing.
Homes are selling within 67 days on average, with premium listings taking longer due to higher price points.
Cost per Sq. Ft. in Sold Properties ($246) is slightly lower than Active Listings ($290), suggesting buyers are negotiating lower final prices.
Luxury properties continue to dominate high-end sales, but mid-range homes remain the fastest-moving inventory.
Ready to Make Your Move? Let’s Talk!
The real estate market is active and evolving — whether you’re buying, selling, or investing , staying ahead of the trends is key!
Sellers
Get top dollar for your home with strategic pricing.
Buyers
Find the perfect property at the right price.
Investors
Maximize your returns with expert insights.
Don’t miss out on the best deals!
Our team is here to help you navigate the market with confidence.


Information Is Believed To Be Accurate But Not Guaranteed. Some or all listings may or may not be listed by the office/agent presenting these featured properties.
Copyright © 2026 1Source Team. All rights reserved